Observability a.k.a O11Y - Diagnose like a doctor
Diagnosing Your IT Systems Like a Doctor
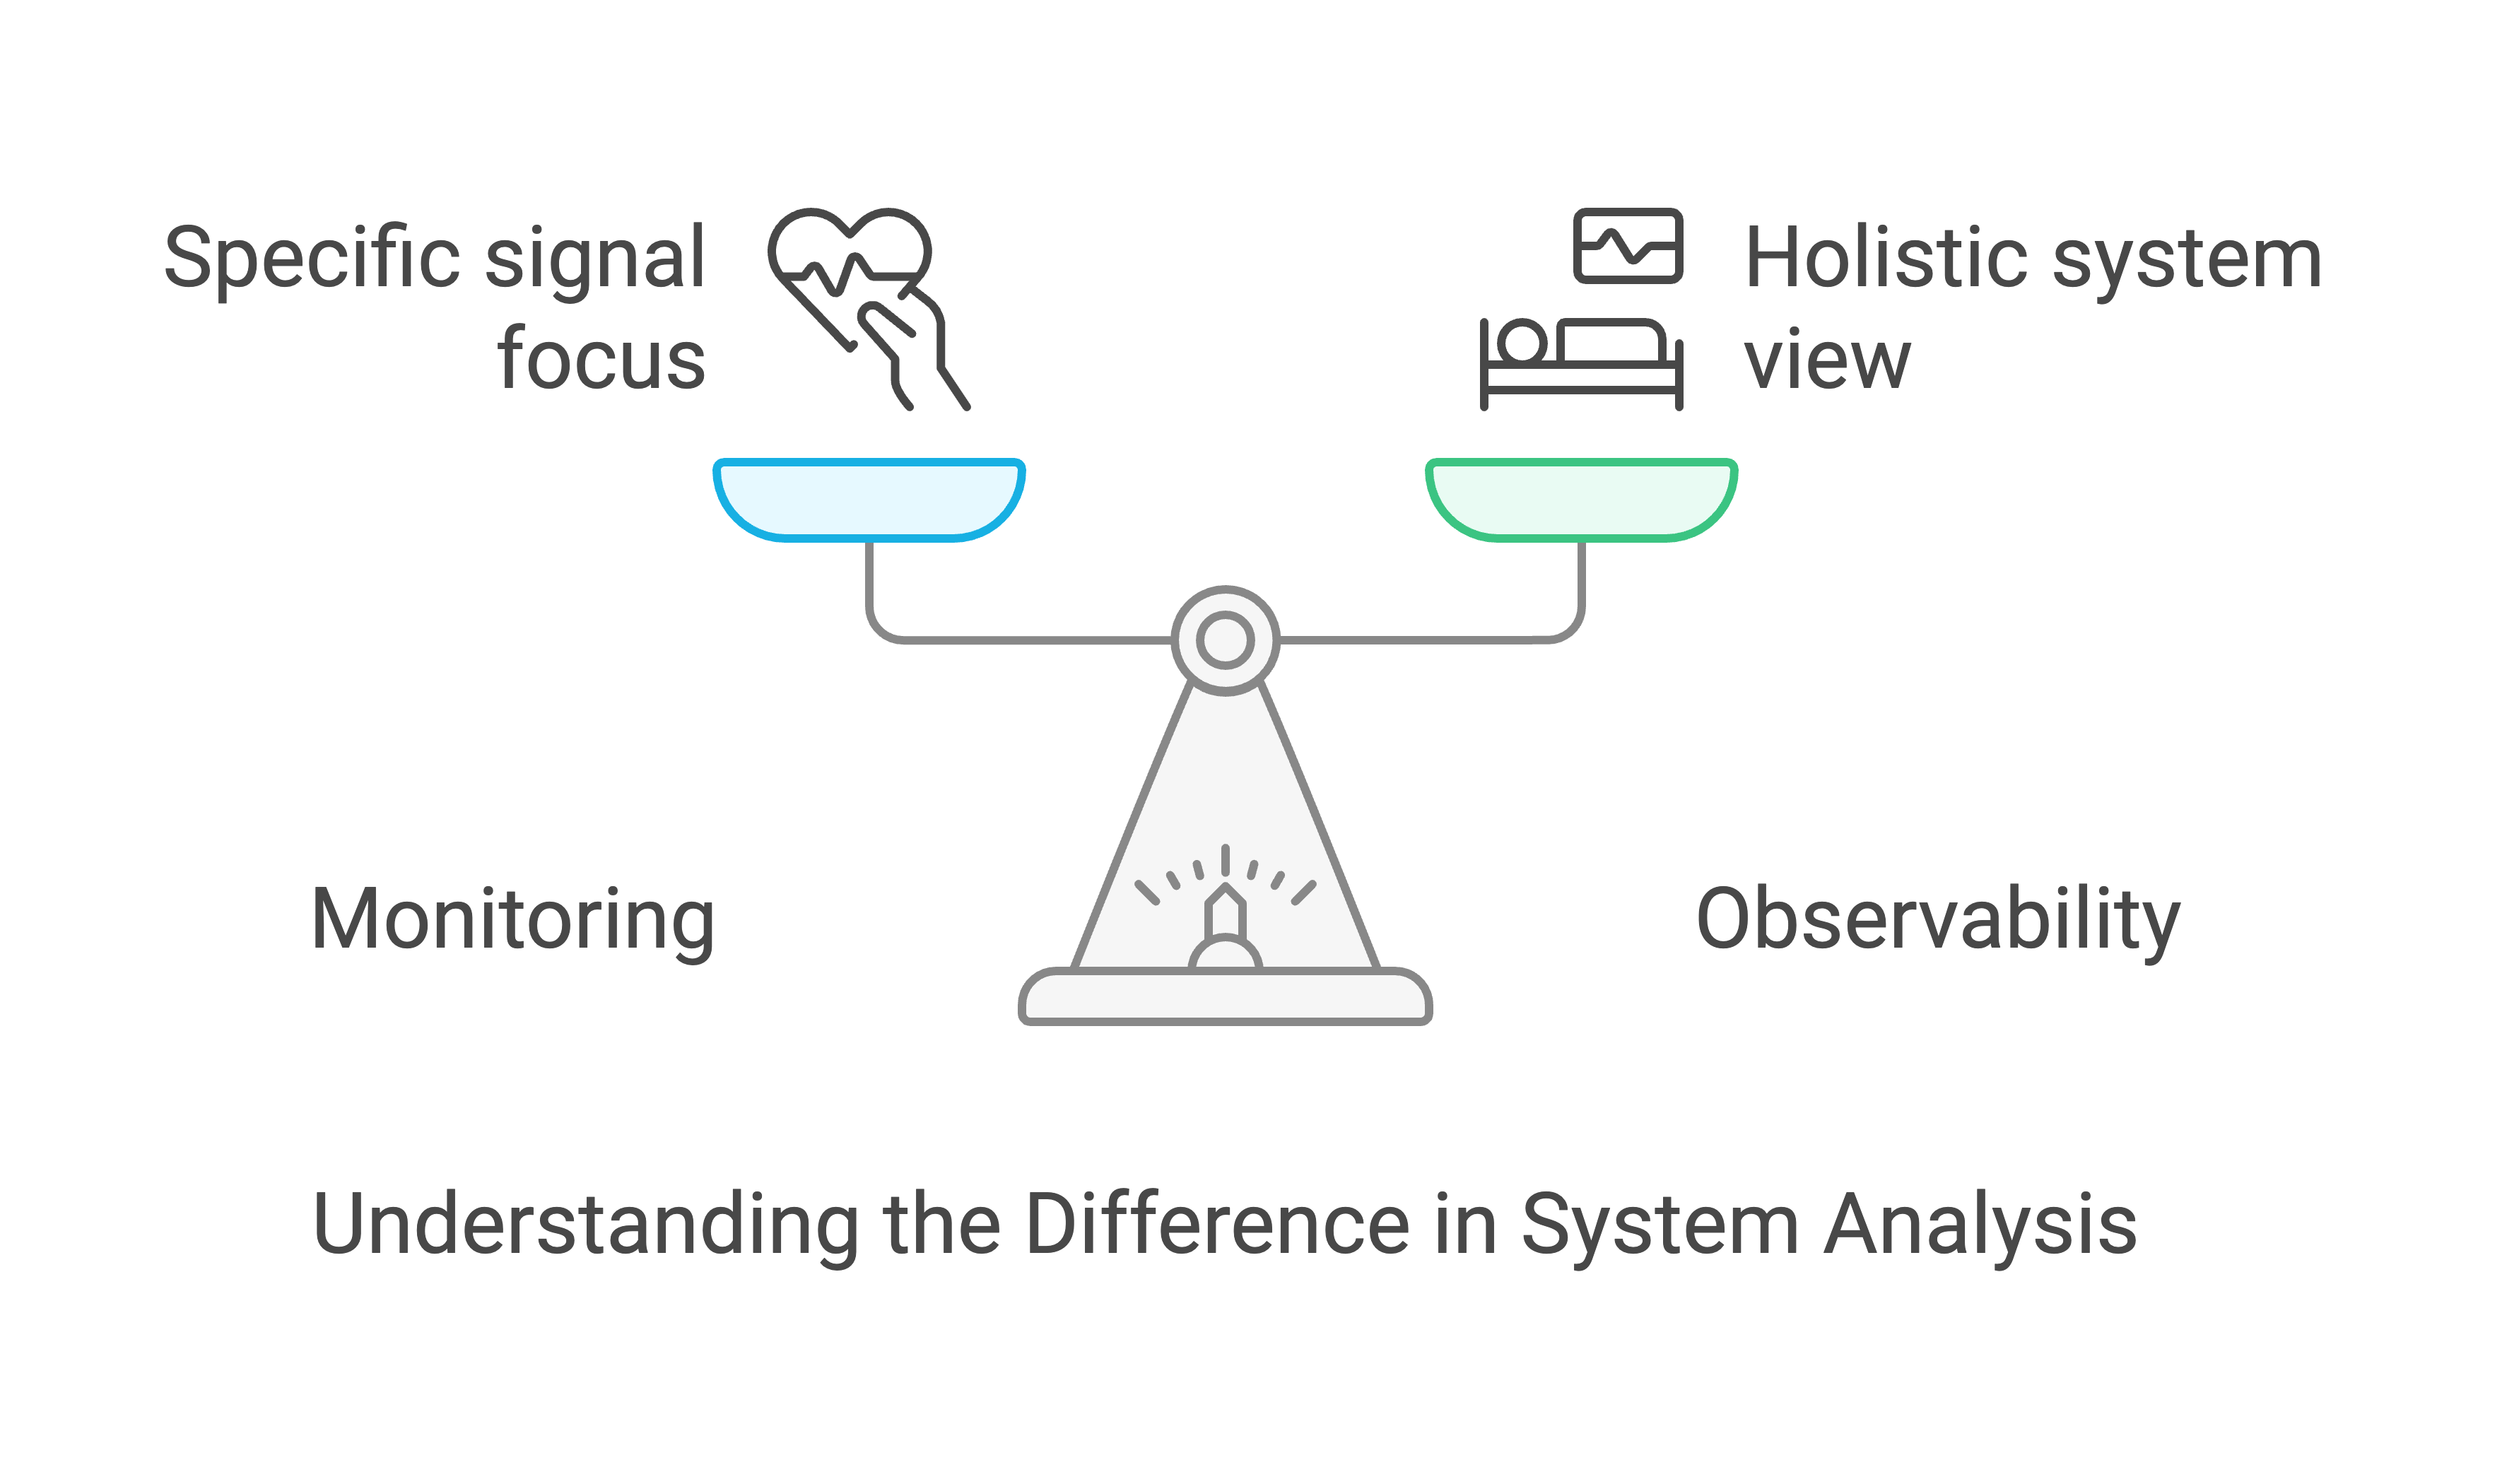
Think of your IT system like the human body. Just as a doctor checks various vitals—like blood pressure, heart rate, and oxygen levels—to understand a patient’s health, observability in IT is the process of collecting various metrics, logs, and traces to assess the health of a system or service. But here’s the twist: monitoring is just one part of that picture. To truly diagnose the health of your IT systems, you need observability, which pulls all the different signals together for a comprehensive diagnosis.
The Doctor’s Analogy: Monitoring vs. Observability
Monitoring – Checking Specific Vitals (Heart Rate, Blood Pressure, Oxygen Levels)
Monitoring – Checking Specific Vitals
Monitoring focuses on tracking specific metrics, such as server uptime, CPU usage, or request latency. These metrics act as specific signals that tell you something about the system but don’t provide a complete picture. For example, a monitoring system might alert you when CPU usage exceeds 90% or when a server is down, but it doesn’t necessarily explain why the system is underperforming or what the impact is on user experience.
Observability – Correlating All the Signals for a Complete Diagnosis
Observability takes multiple signals from across the system—logs, metrics, and traces—to provide a more complete understanding of its health. By correlating these data points, observability helps you pinpoint the root cause of problems, track performance over time, and optimize the system for better overall health. For instance, observability can reveal not just that CPU usage is high, but also whether memory leaks, slow database queries, or microservices latency issues are contributing to the problem.
The Key Difference: Monitoring Alerts You, Observability Helps You Diagnose
Monitoring is about setting up alerts based on predefined conditions. If a metric goes out of the ordinary (like blood pressure spiking), you get an alert. However, monitoring doesn’t explain why it spiked or what you should do about it.
Observability, on the other hand, helps you diagnose the issue based on all the available data. It’s not just about noticing when things are wrong but about understanding why they went wrong and what needs to be done to fix them. Observability helps teams to drill down and find the root cause, make informed decisions, and take proactive steps to maintain system health.
For example, if your website is running slow, monitoring might alert you to high response times, but observability will help you trace the issue back to a slow database query or a faulty third-party API and suggest a solution. If your website is running slow, monitoring might alert you to high response times, but observability will help you trace the issue back to a slow database query, or a faulty third-party API, and suggest a solution.
Why Observability is Crucial for Modern IT Systems
In today’s distributed systems, where microservices, cloud environments, and complex architectures are the norm, observability becomes even more essential. Monitoring is like checking a few vitals on a single patient, but observability is what lets you understand the health of an entire system of systems, each with its own dependencies and behaviors.
- Scalability: As your system grows, the complexity of monitoring also grows. Observability helps you maintain the same level of insight across distributed services and varying environments.
- Proactive Problem Solving: With observability, you’re not just reacting to alerts; you’re continuously analyzing data to prevent issues before they even arise.
What Signals Should We Look For?
Logs
Logs are like a patient’s medical history—they provide a detailed account of events and actions in the system. Logs capture what happened, where it happened, and often, why it happened. For instance, when an error occurs, the log will tell you the function or service that failed and what the specific issue was (e.g., an exception thrown, or a failed API call).
- Key Signals from Logs:
- Errors, exceptions, and stack traces.
- Security events like unauthorized access attempts or login failures.
- Application-level events like user transactions or background tasks.
Metrics
Metrics provide quantitative measurements that offer insight into how well the system is performing. They are more like a snapshot of system health, giving you a sense of the “vital signs” of the system—CPU usage, memory consumption, request throughput, and error rates.
Key Metrics to Track:
- CPU Usage: The percentage of CPU resources consumed by services or applications.
- Error Rates: Number of failed requests (5xx errors), or other failed transactions.
- Request Rates: The volume of incoming requests, transactions, or API calls.
- Latency/Duration: Time it takes for a request to travel through the system and return a response.
Traces
Traces provide insight into the journey of a request through your system. It’s like a detailed map of how the system components interact with each other and how a request travels from one service to another. Tracing can help identify where bottlenecks are happening in complex, distributed systems.
- Key Traces:
- End-to-End Request Tracing: From the client’s request to the final response.
- Service-to-Service Communication: How services call each other, and where delays or failures occur.
- Database Queries: The performance of individual queries and how they impact overall response times.
The Evolution of Observability: New Signals in the Age of AI
As we move toward more complex systems—particularly those leveraging AI, machine learning, and advanced automation—the traditional observability pillars of logs, metrics, and traces need to expand. In AI systems, for instance, we may need to monitor new kinds of metrics and logs that reflect the behavior of AI agents, such as:
- AI Toxicity: Are the outputs of the AI model biased or harmful?
- AI Accuracy: How accurate are the AI predictions or recommendations?
- Safety & Robustness: Are there risks of the model making dangerous or unintended decisions?
In the age of AI, observability now also means assessing the internal health of AI systems and ensuring they are not only performant but also ethical and aligned with safety standards.
Guided Methodology for Focusing on the Right Signals
Now that we know which signals to look for, the question becomes: How do we know which signals are the most critical for my system? Luckily, there are a couple of widely adopted methodologies that help you choose and correlate the right signals to get a true picture of your system’s health.
RED and USE Methodologies
For systems that follow a request-response model or need to diagonize hardware faults, two popular methodologies are commonly used to focus on the right signals: RED and USE.
RED:
- Request Rate: How many requests are coming in?
- Error Rate: What percentage of those requests are failing?
- Duration: How long does it take to serve a request?
USE:
- Utilization: How much of your system’s resources (CPU, memory) are being used?
- Saturation: Are you reaching the system’s resource limits?
- Error Rate: Similar to RED, what is the error rate of the service?
These methodologies can help you zero in on the most important signals for request-response systems, ensuring that you capture critical performance data without overwhelming yourself with irrelevant metrics.
Correlating Signals for Complete Observability
The real challenge of observability isn’t just about collecting signals; it’s about correlating them to get a true picture of system health. When multiple signals are in play, it’s easy for one signal (e.g., high error rates) to be misinterpreted in isolation. Correlation means connecting the dots across logs, metrics, and traces to uncover the root cause of problems.
For instance:
- A spike in error rate may be related to high traffic or insufficient resources.
- Long response times might be caused by a specific service bottleneck or database performance issues.
By correlating different signals at the same point in time, you can diagnose problems faster and more accurately.
Google SRE’s Golden Signals
Google’s Site Reliability Engineering (SRE) team defined four golden signals that are essential for understanding the health of any service:
- Traffic: How much demand is there on the service? This could be request rates, or the number of users interacting with the system.
- Error Rate: What percentage of requests are failing? High error rates often indicate serious issues.
- Duration: How long does it take to process requests? Increased latency or time-to-serve is a sign of a problem.
- Saturation: Are the system’s resources saturated (e.g., CPU, disk space)? If so, the system will not be able to handle more requests.
Conclusion: Treat Your IT Systems Like You Would Your Health
Just as regular checkups with a doctor can prevent major health issues, constant monitoring and observability can help you maintain the health of your IT systems. Monitoring keeps you aware of problems, but observability helps you understand and solve them. By combining the two, you can ensure that your systems are not just running, but thriving.
Key Takeaways:
- Monitoring = Tracking specific metrics and setting up alerts.
- Observability = Correlating logs, metrics, and traces to gain deep insights into the health of your entire system.
- Together: They help you diagnose, fix, and optimize your systems effectively.
Coming Soon…
In the next post, we’ll dive into techniques for correlating signals and establishing a robust observability framework that can handle modern systems’ complexity.